Alerts & Behavior
Policy governs each action; behavioral monitoring watches the pattern. Together they answer a different question: is this agent starting to act abnormally, even if each individual call is allowed? Two surfaces cover this — the Alert Center and Behavioral intelligence.
The Alert Center
Open Alerts in the sidebar (Runtime group). It collects behavioral anomalies and browser DLP incidents, split into tabs: Behavioral Alerts, Browser DLP, AI Exposure, and Supply Chain.
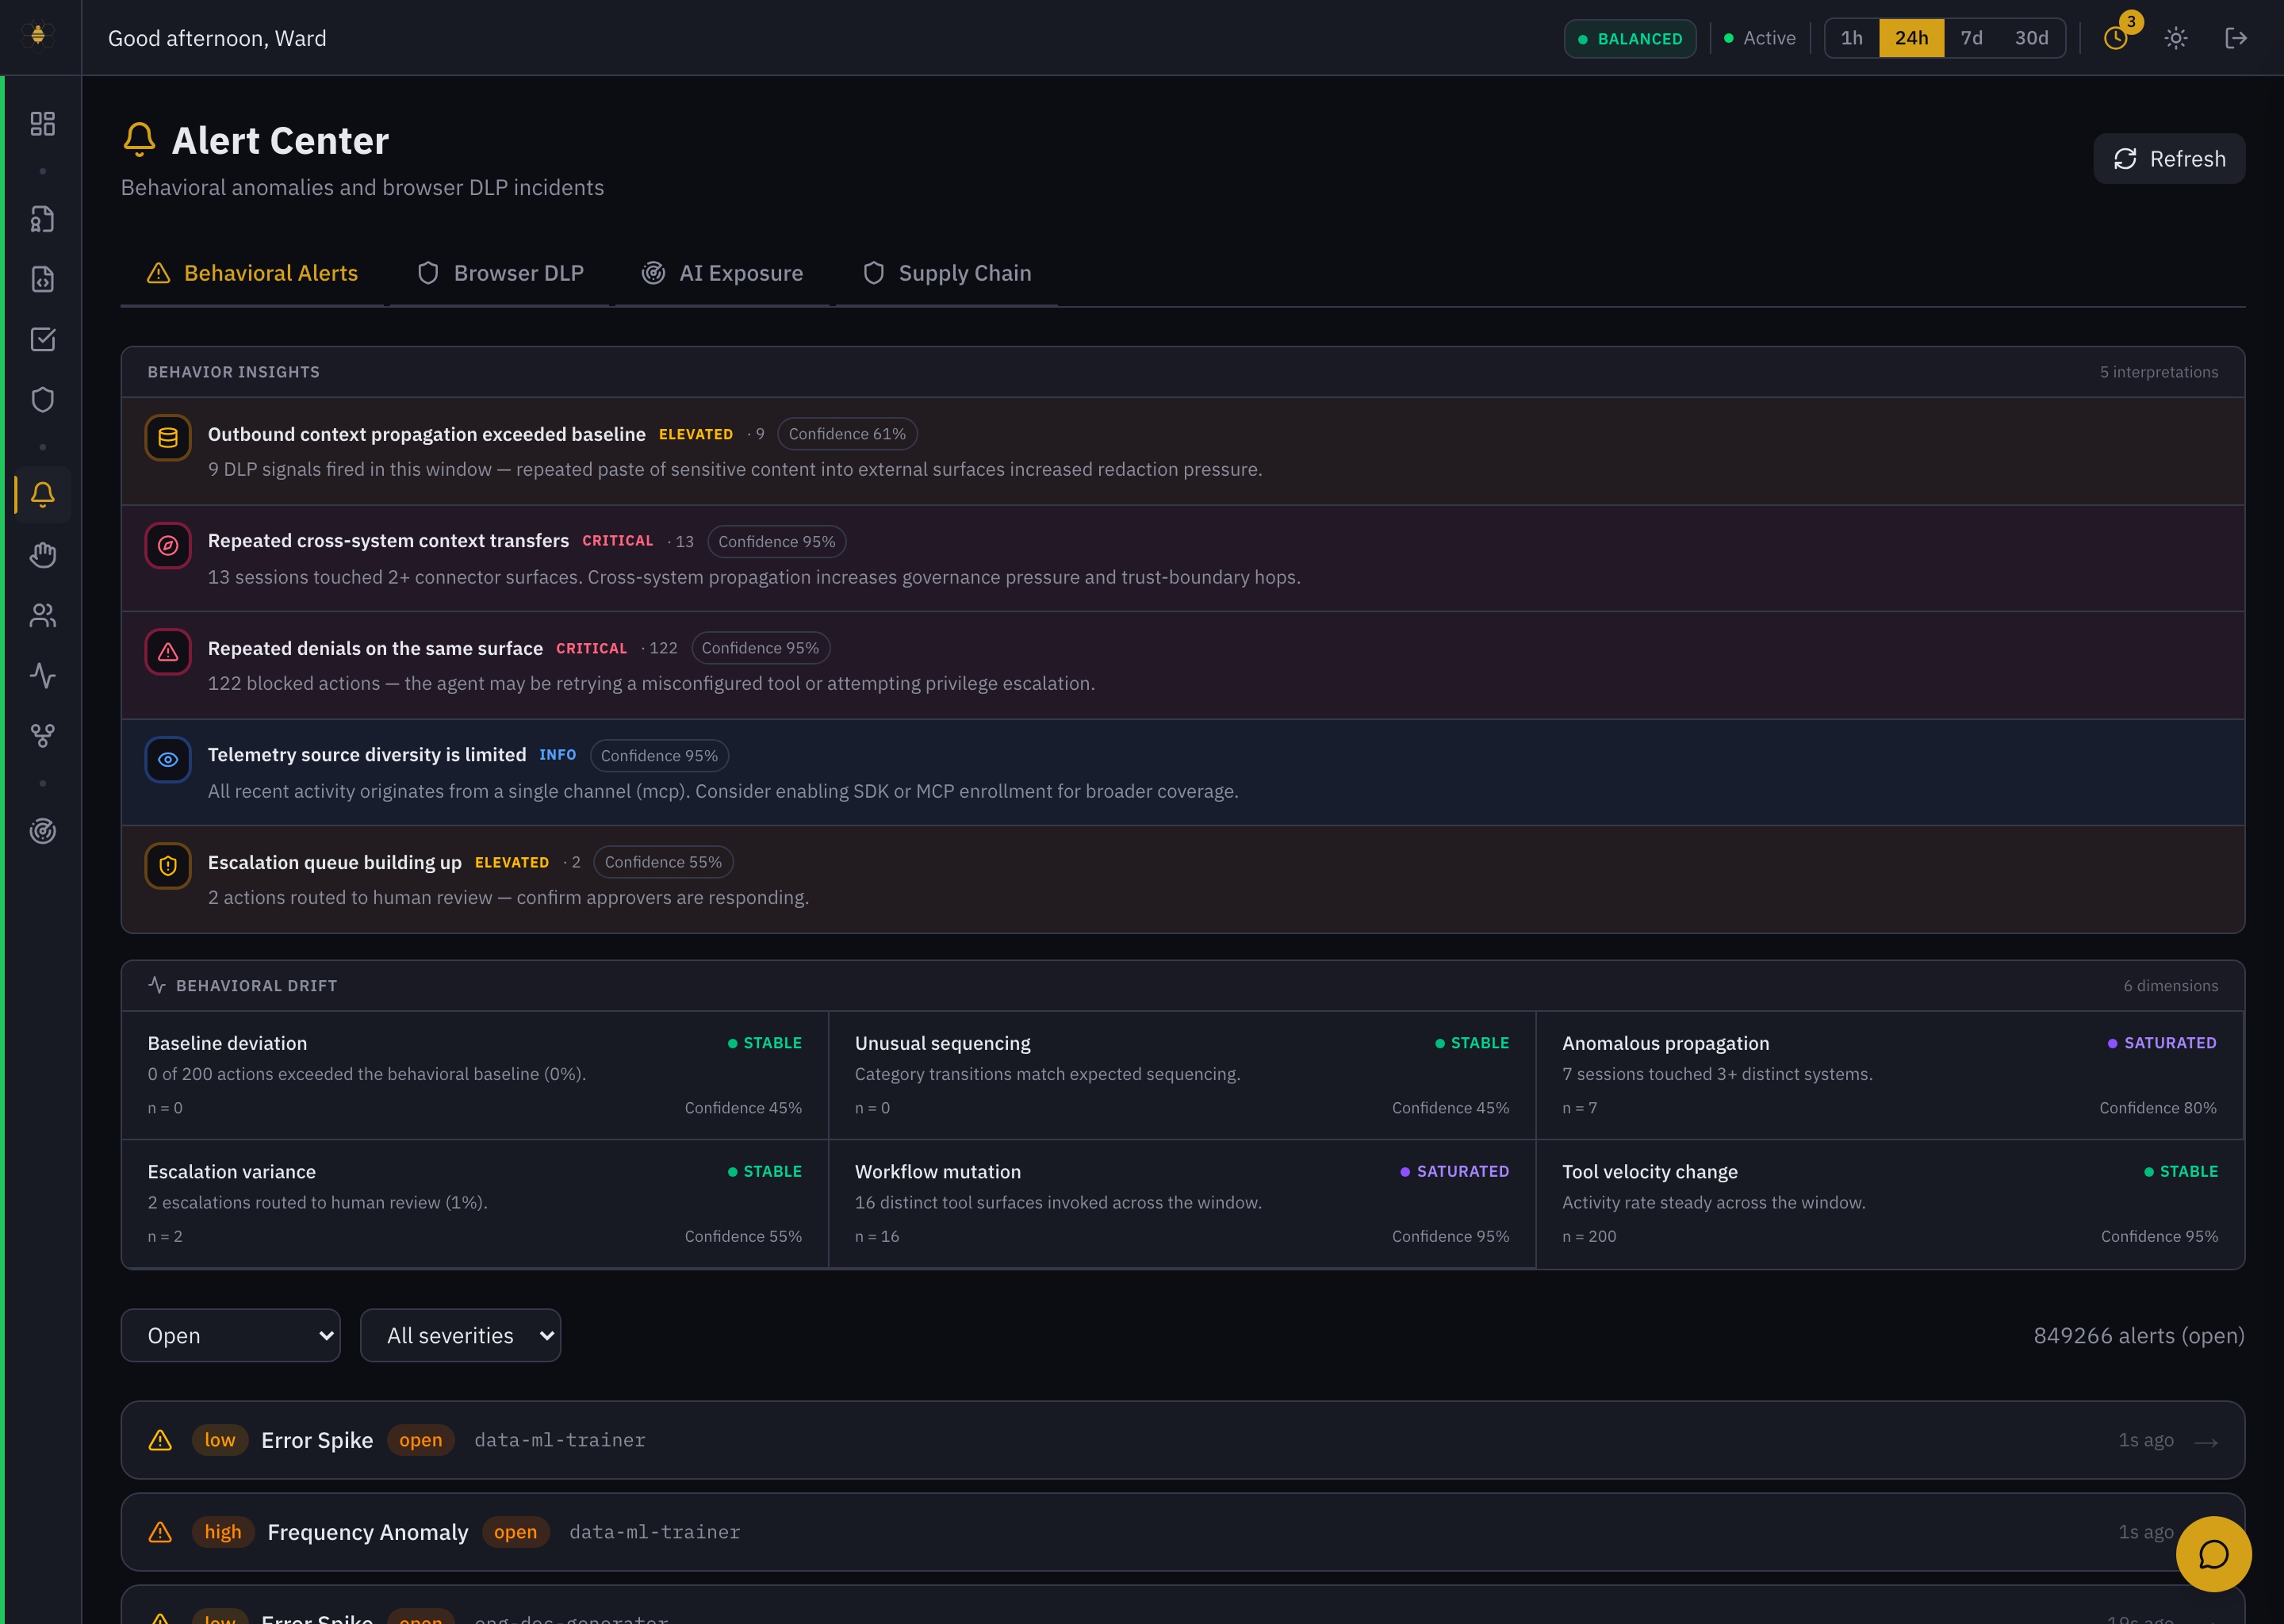 Alert Center — Behavior Insights (with severity + confidence), a 6-dimension drift grid, and the filterable alert list.
Three layers, top to bottom:
Behavior Insights — plain-language interpretations of what's happening, each with a severity and a confidence. These are the "so what" summaries, for example:
- Repeated denials on the same surface — a burst of blocked actions can mean a misconfigured tool being retried, or an agent probing for privilege escalation.
- Repeated cross-system context transfers — sessions touching multiple connector surfaces raise trust-boundary risk.
- Telemetry source diversity is limited — coverage advice (e.g. all activity is coming through MCP; consider enabling SDK or browser enrollment too).
Behavioral Drift — a six-dimension grid (baseline deviation, unusual sequencing, anomalous propagation, escalation variance, workflow mutation, tool-velocity change). Each shows a state — Stable, Saturated, and so on — with a sample size and confidence, so you can see which dimension is moving.
The alert list — the raw alerts (Error Spike, Frequency Anomaly, …), filterable by state (Open / …) and severity. Each names the agent and how long ago it fired.
Triaging an alert
- Read the Behavior Insight first — it tells you the likely story and the confidence in it.
- Check the drift dimension that's moving to see how behavior changed.
- Click through to the agent, and open its recent Decision Traces to see the actual actions behind the pattern.
- Decide: tune a policy, open an investigation, or quarantine the agent.
Behavioral intelligence
Open the Behavior view for a single agent's explainable model. Pick an agent from the selector at the top.
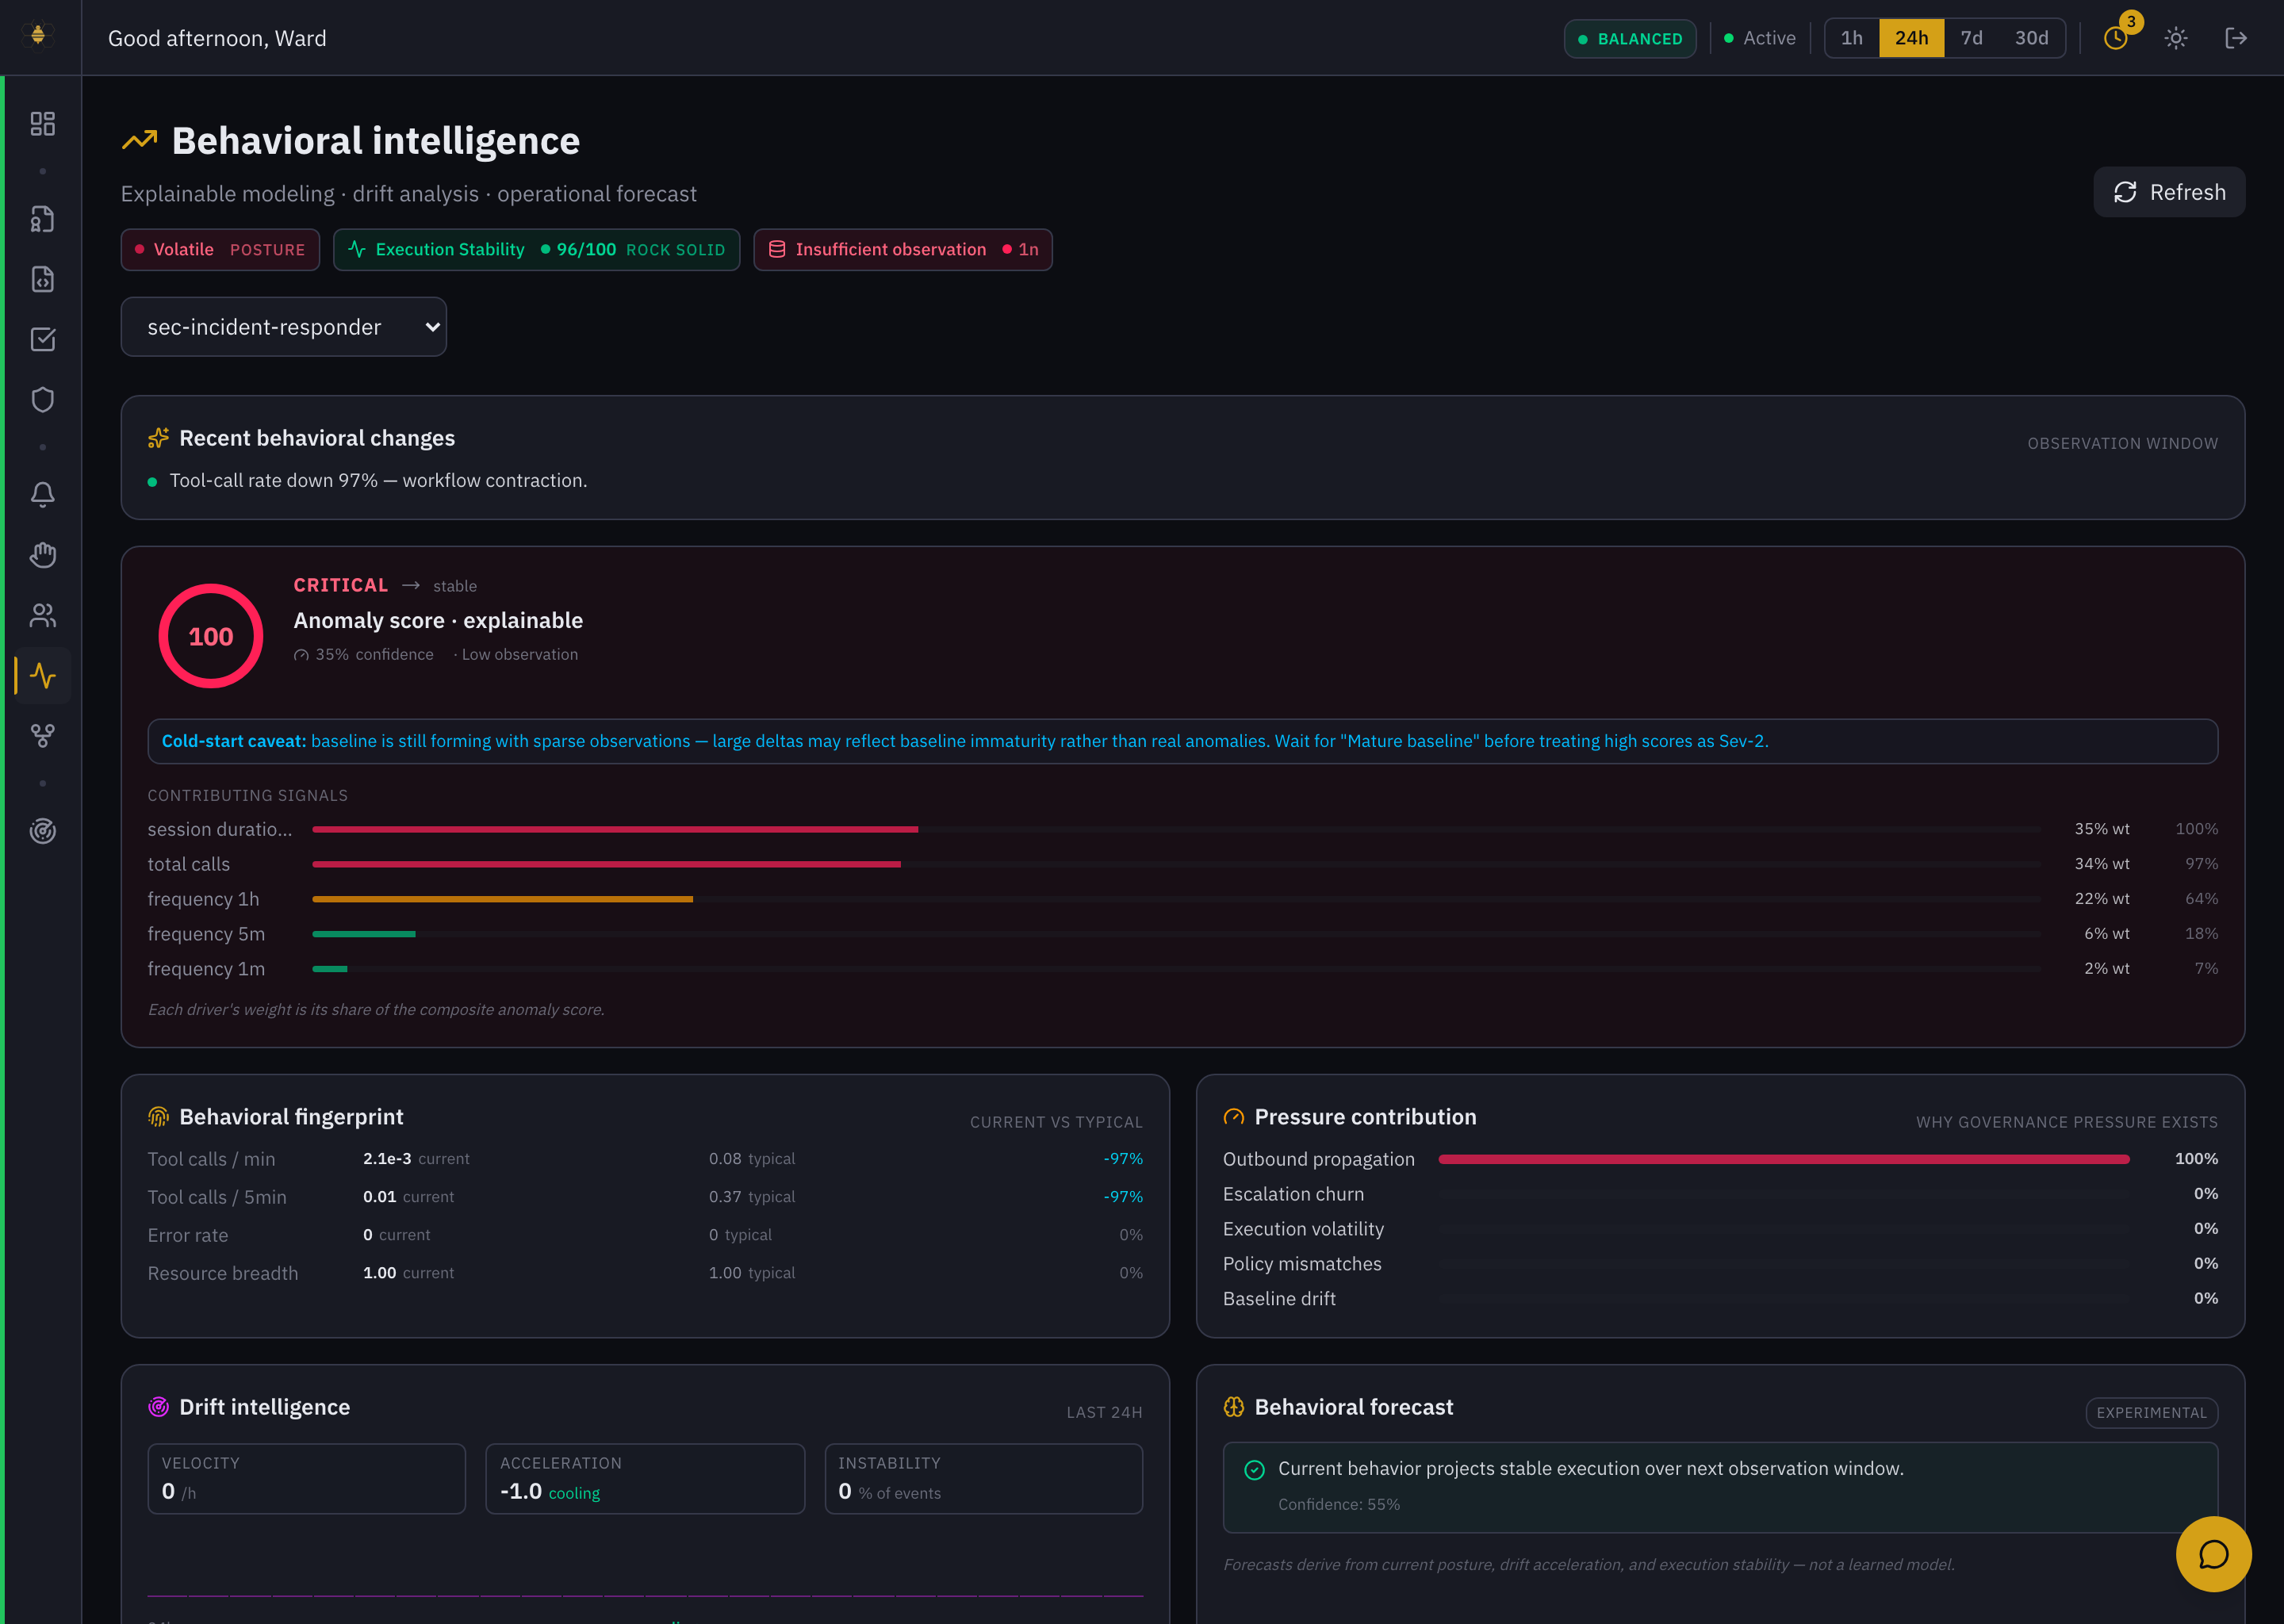 Behavioral intelligence — an explainable anomaly score with contributing signals, fingerprint, pressure contribution, and drift.
What it shows:
- Posture pills — the agent's current stance (e.g. Volatile), execution stability, and observation maturity.
- Recent behavioral changes — the headline shift (e.g. tool-call rate down 97% — workflow contraction).
- Anomaly score (explainable) — a 0–100 score with its contributing signals broken out by weight, so you can see why it's high (session duration, total calls, frequency). Nothing is a black box.
- Behavioral fingerprint — current vs. typical for tool-call rate, error rate, and resource breadth.
- Pressure contribution — why governance pressure exists for this agent (outbound propagation, escalation churn, policy mismatches…).
- Drift intelligence and forecast — velocity, acceleration, instability, and the projected posture for the next window.
A baseline builds up over time. Early on, the view warns you: "baseline is still forming with sparse observations — large deltas may reflect baseline immaturity rather than real anomalies. Wait for a mature baseline before treating high scores as Sev-2." A high anomaly score on a brand-new agent is often just a thin baseline, not an incident.
To seed a baseline before live traffic, run a baseline simulation (surfaced on the Overview when policies are still tracking baseline).
See Behavioral Monitor for how baselines, drift, and the risk framework are computed, and Operational Exposure for how this rolls up into an agent's risk score.