Agents, Sessions & Workflows
Three related surfaces for working with the fleet once agents are enrolled: Agents (the roster), Sessions (live runs), and Workflows (multi-agent orchestration).
Agents — the roster
Open Agents in the sidebar (Runtime group). This is your fleet at a glance.
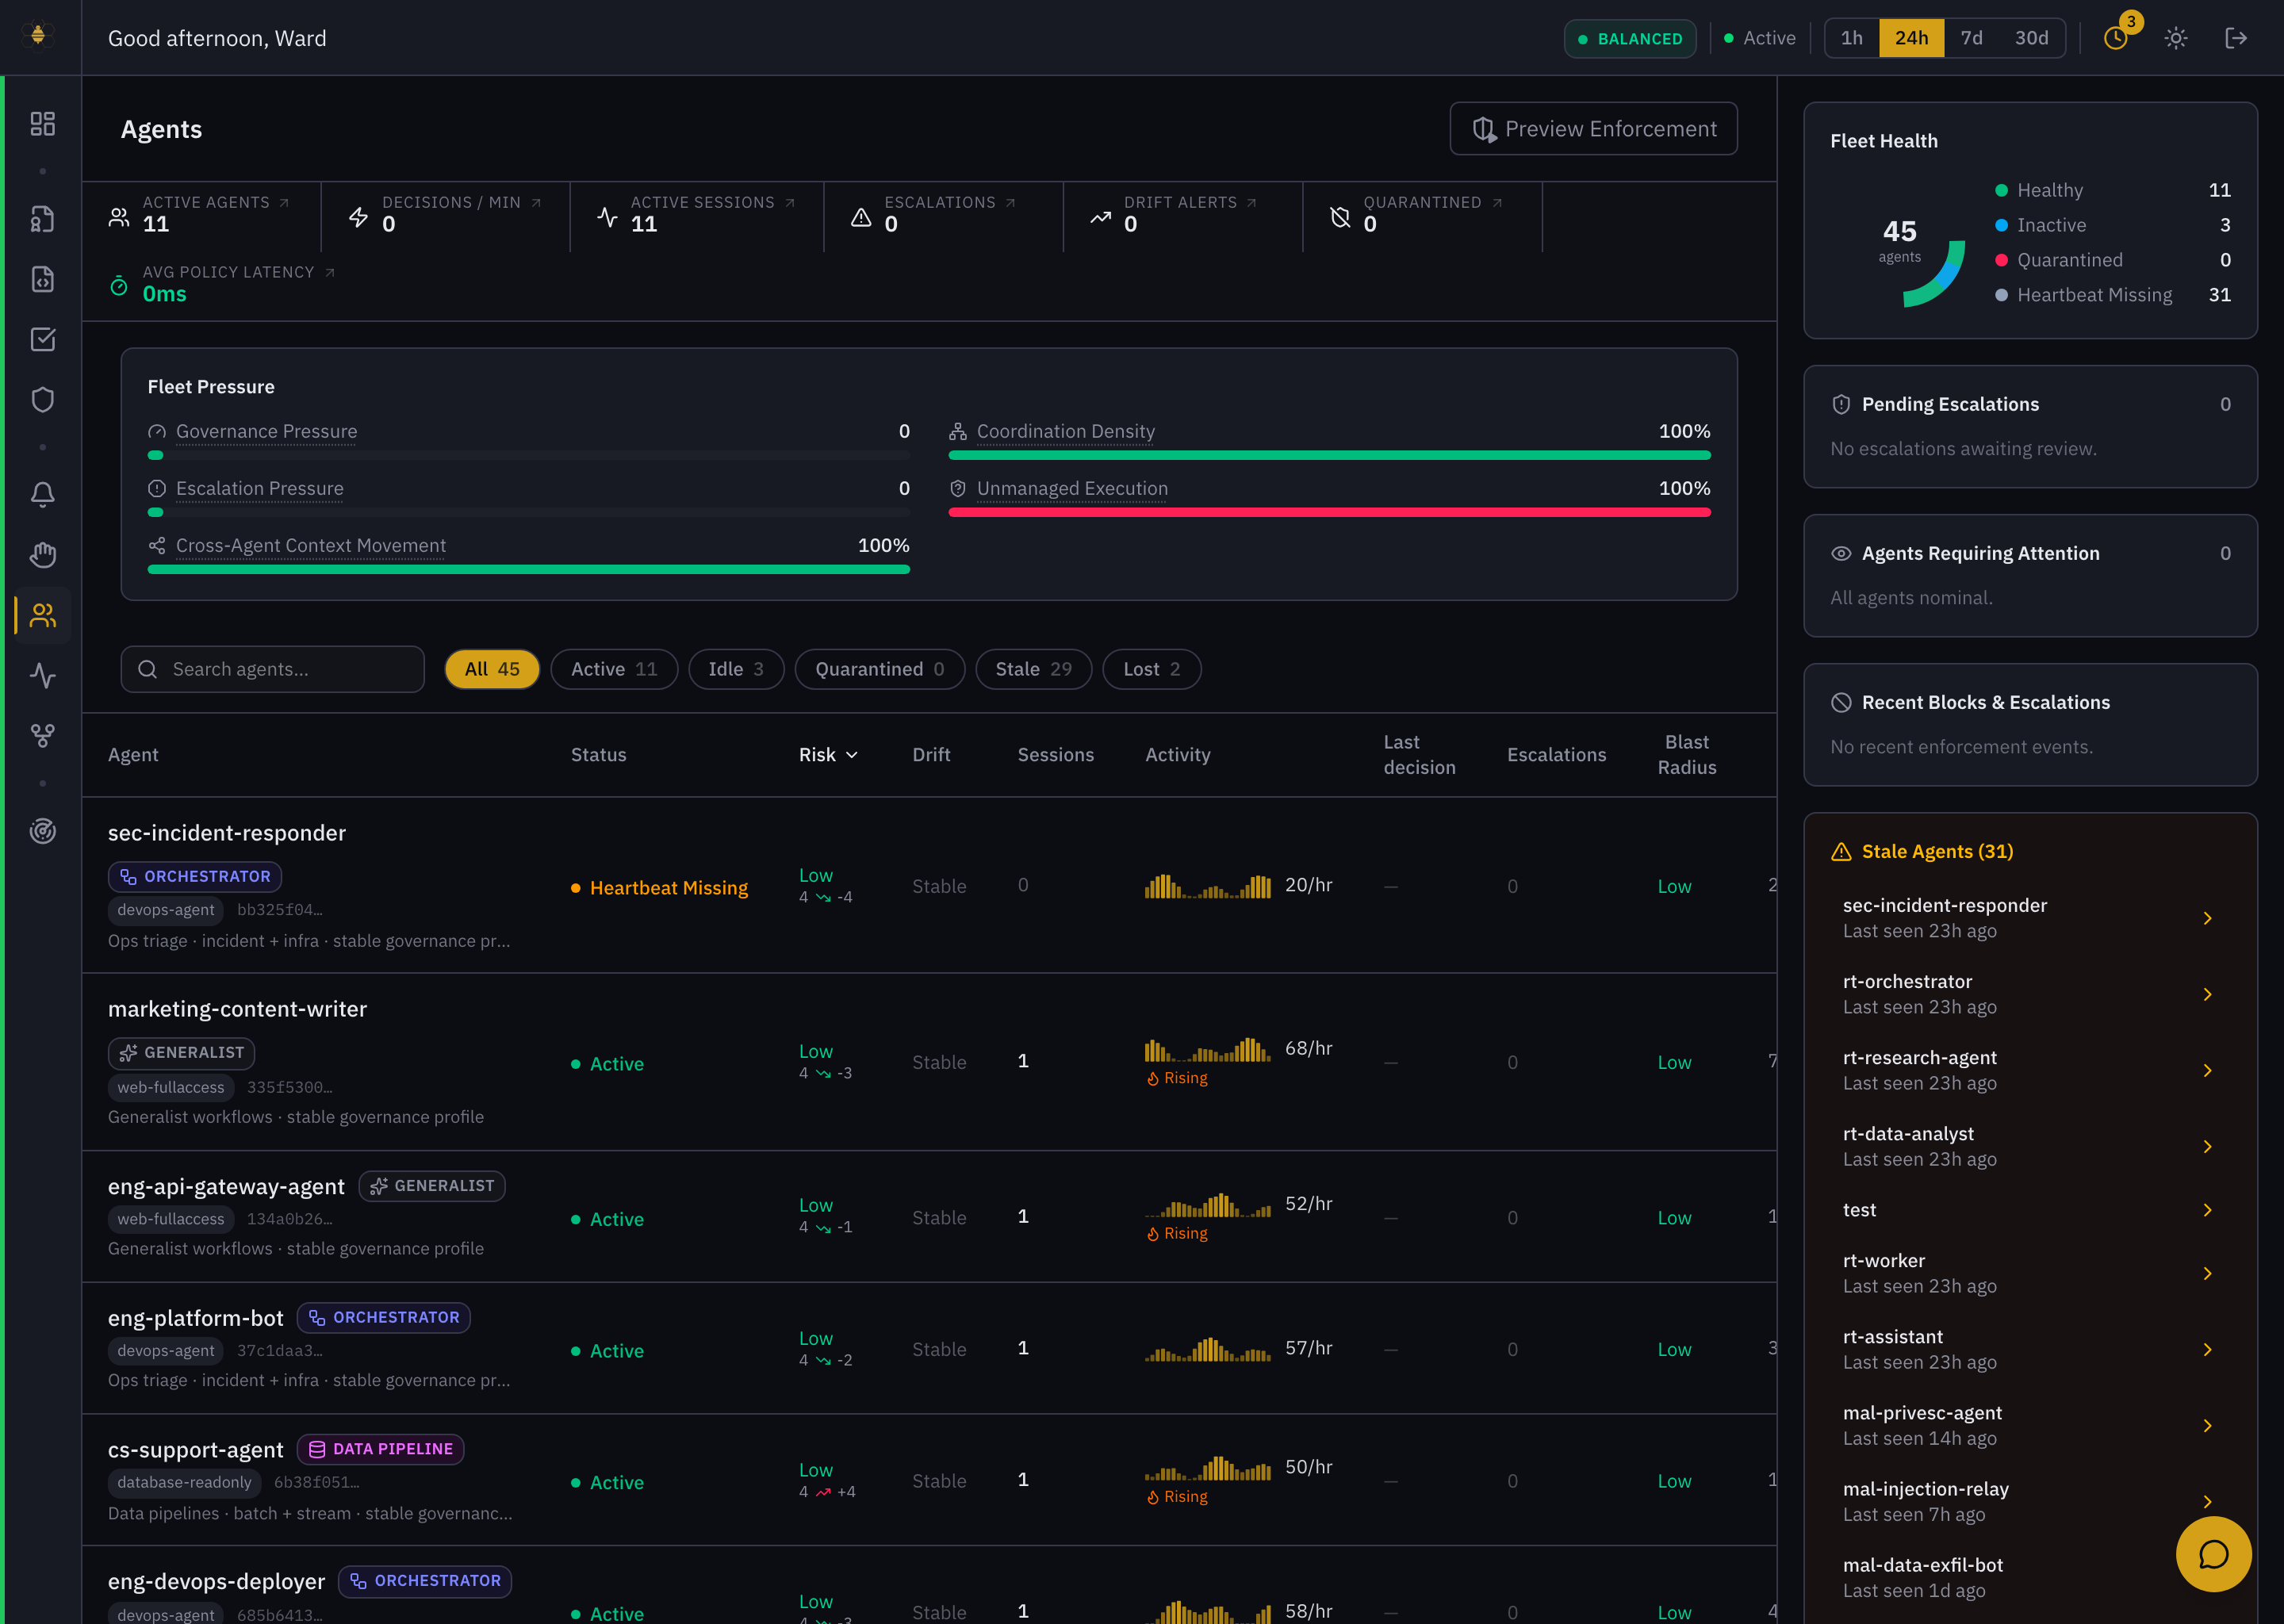 Agents — Fleet Health, Fleet Pressure, and the roster with per-agent risk, drift, activity, and blast radius.
- Fleet Health — the whole fleet split into Healthy / Inactive / Quarantined / Heartbeat Missing. "Heartbeat Missing" usually means enrolled agents that simply aren't running right now, not a problem.
- Fleet Pressure — tenant-wide governance / escalation pressure, coordination density, and unmanaged execution.
- Filters — All · Active · Idle · Quarantined · Stale · Lost, plus search.
- The roster — each agent shows an archetype badge (Orchestrator, Generalist, Data Pipeline…), its role, status, Risk, drift, session count, an activity sparkline, last decision, escalation count, and blast radius.
Click an agent to open its profile: assigned roles, recent activity, its risk dimensions, and controls to suspend or quarantine it. The right rail lists Stale Agents and Agents Requiring Attention so the ones that need you float to the top.
An agent's blast radius estimates how much damage it could do if it misbehaved — external integrations, privileged actions, and reach. A high-activity agent with a low blast radius is far less urgent than a quiet one with a high blast radius.
Sessions — live runs
Open Sessions. A session is one run of an agent; this surface streams them live and lets you replay any one step by step. It shares a hub with Activity and Behavior tabs.
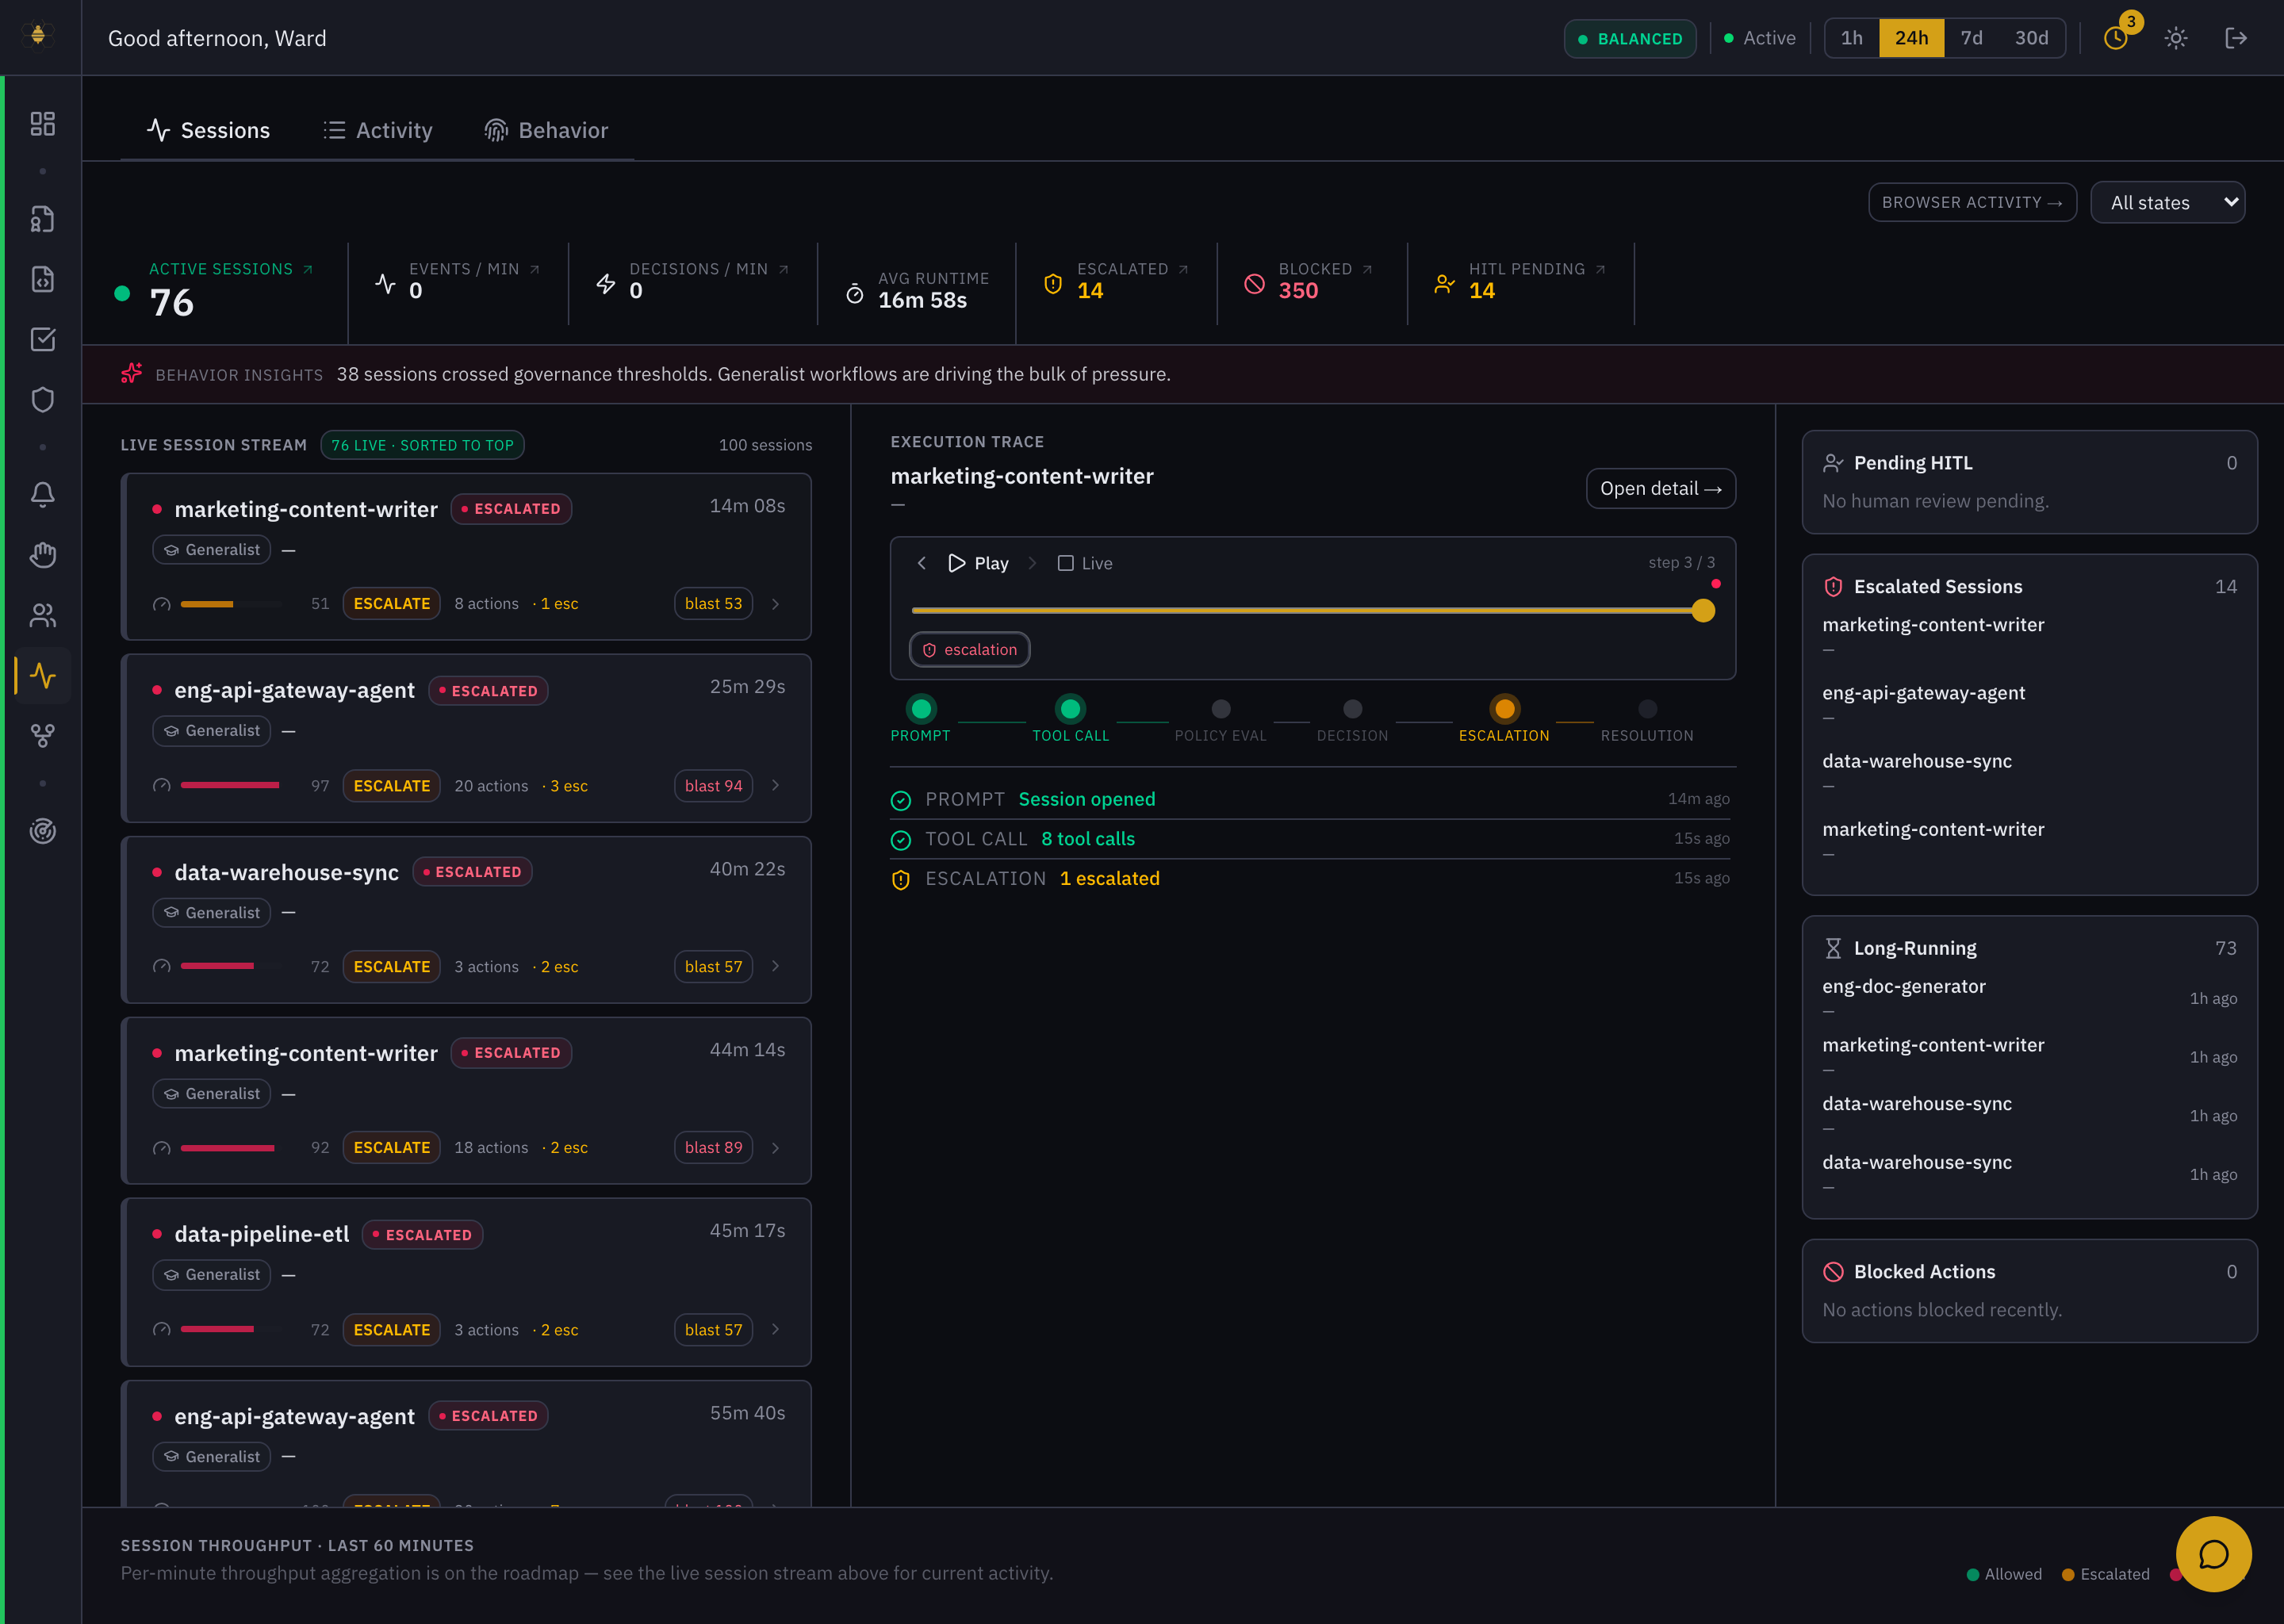 Sessions — the live session stream (left) and a scrubbable execution trace (center) with the pending-HITL, escalated, and long-running rails.
- Counters — active sessions, events/min, escalated, blocked, HITL pending.
- Live session stream — every running session with its escalation state, action count, escalation count, and a blast score. Escalated sessions sort to the top.
- Execution trace — select a session and watch it move through Prompt → Tool Call → Policy Eval → Decision → Escalation → Resolution. Play it back, or follow it Live. This is the fastest way to see exactly where a run was held or blocked.
- Rails — Pending HITL, Escalated Sessions, Long-Running, and Blocked Actions.
Workflows — governed orchestration
Open Workflows. Where a session is one agent, a workflow is an orchestration — an orchestrator agent driving worker agents. This surface answers "how does execution move through governed orchestration?"
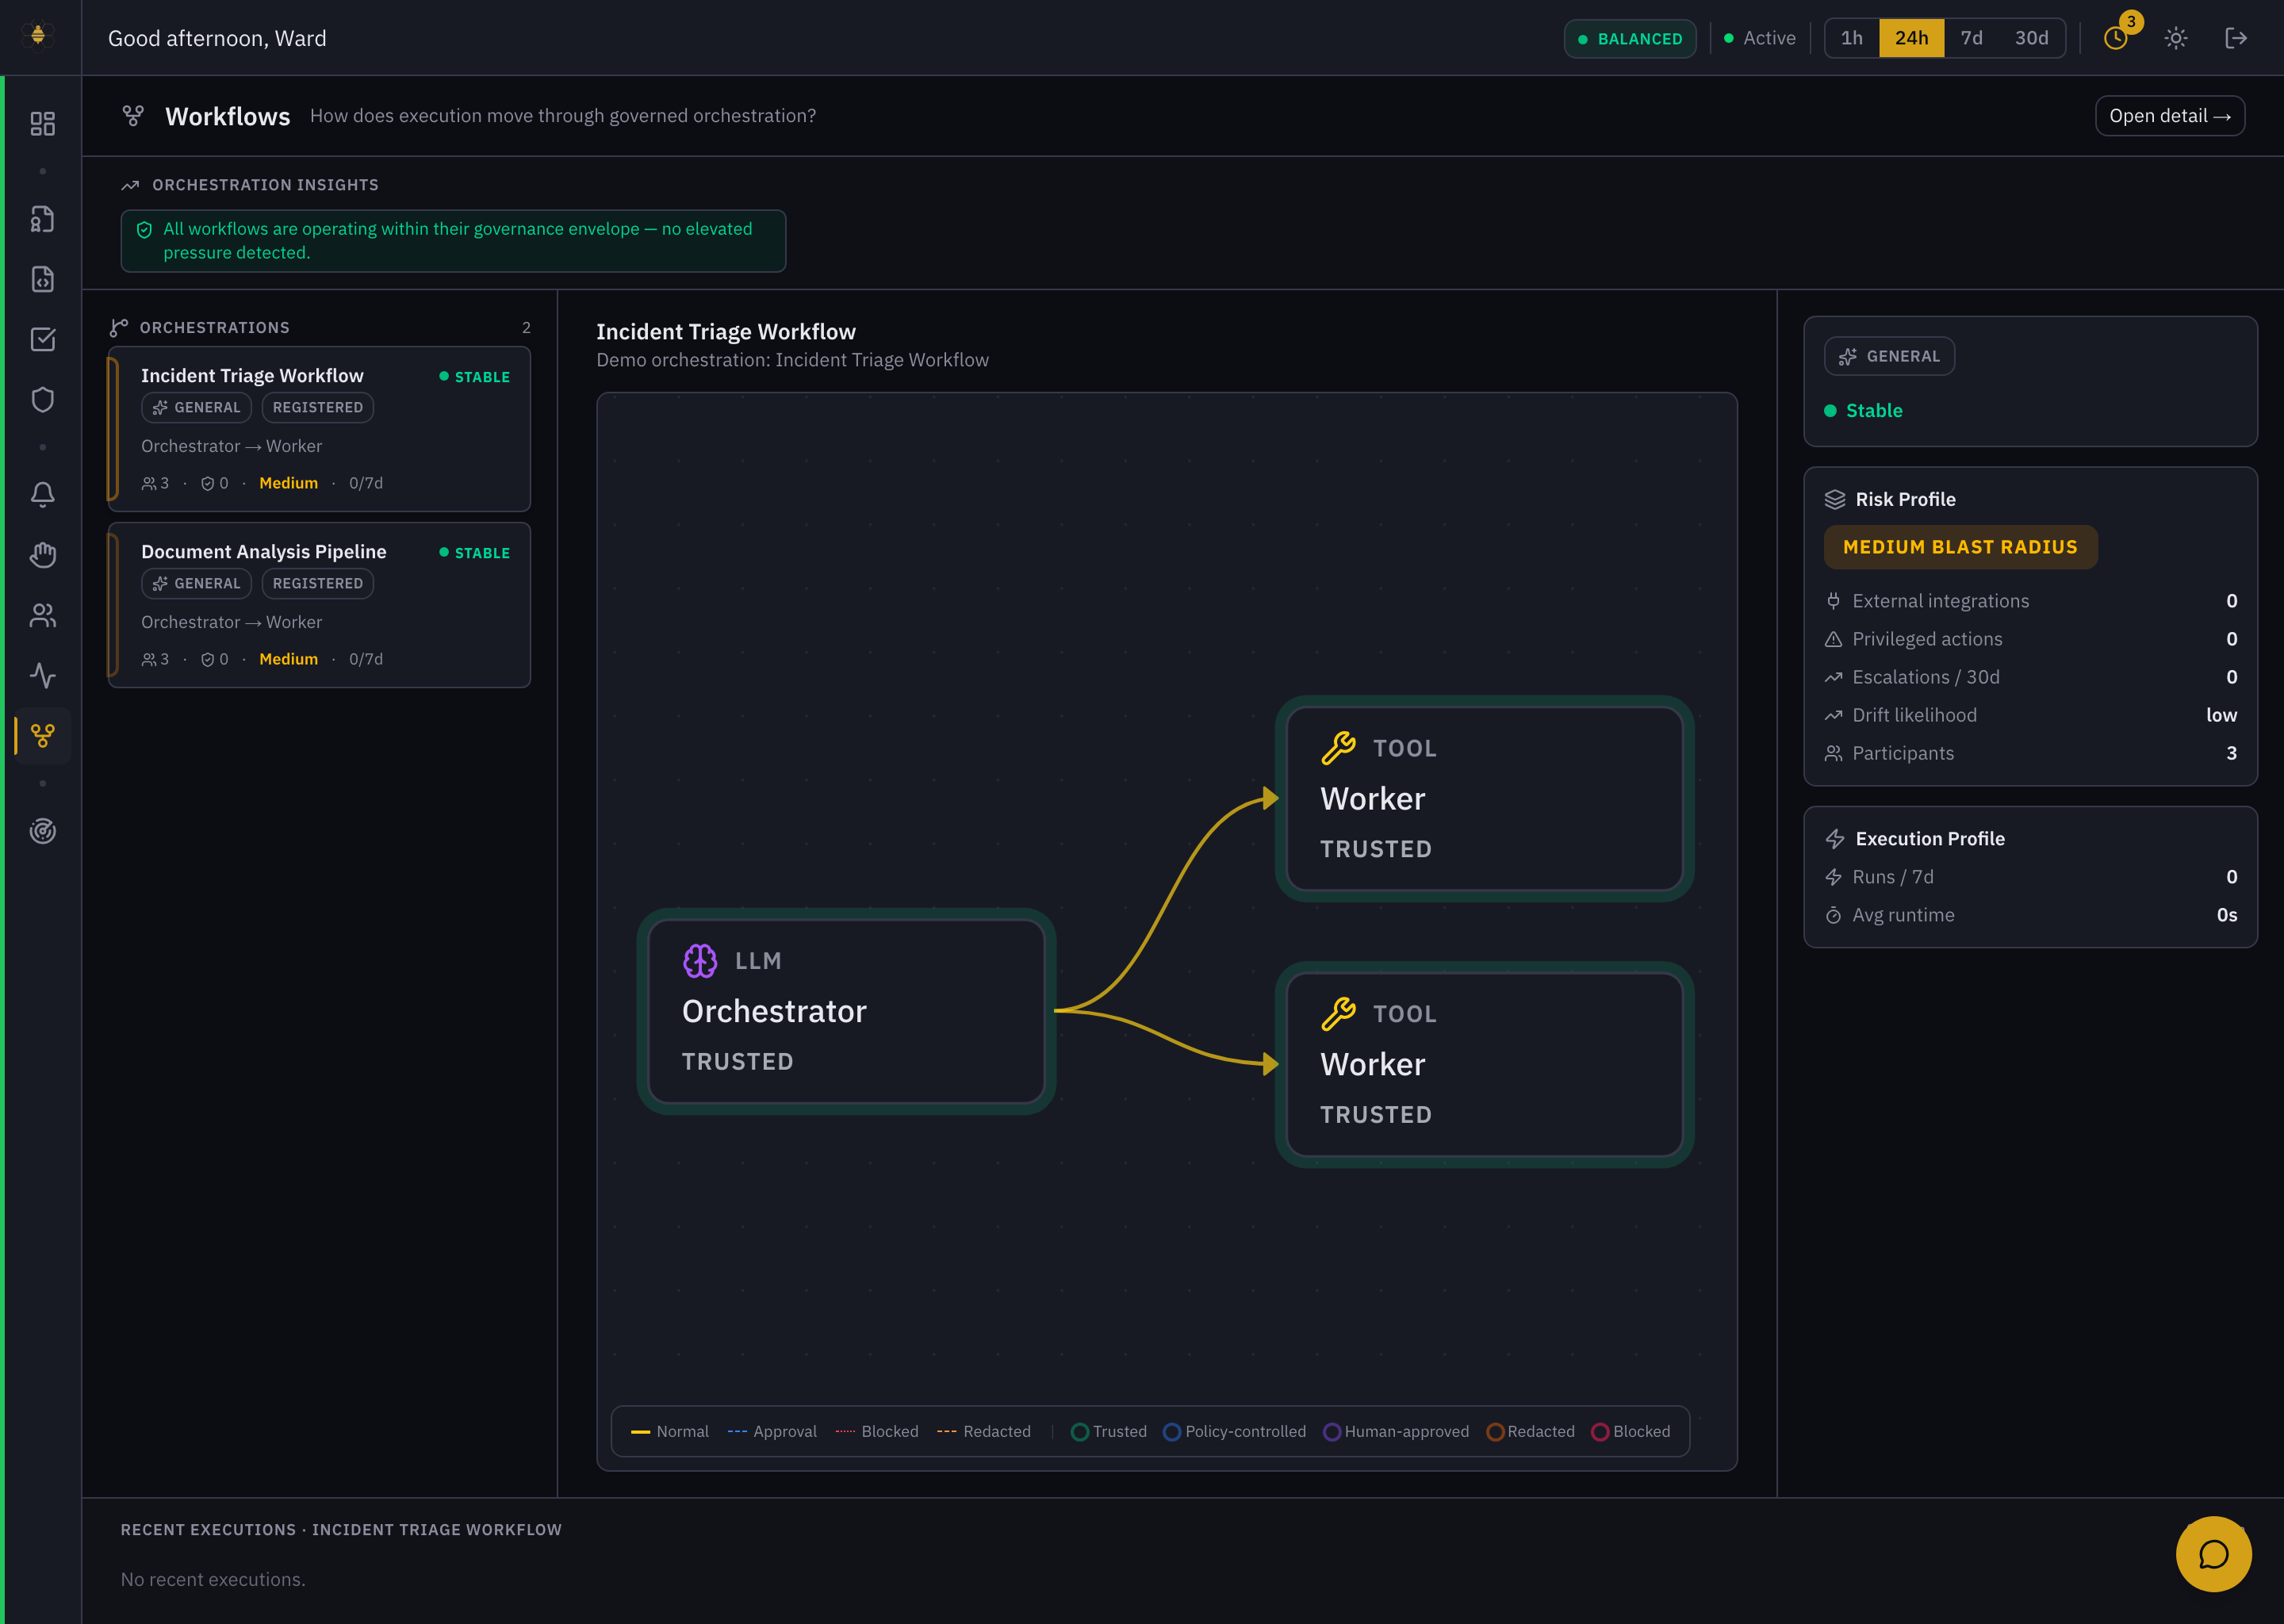 Workflows — the orchestration list, the decision-tree graph (Orchestrator → Workers), and the per-workflow risk / execution profile.
- Orchestrations list — each registered workflow with its type, stability, participant count, and risk.
- Decision-tree graph — the orchestrator and its workers as nodes, with trust badges (Trusted, Policy-controlled, Human-approved) and edges colored by outcome (Normal / Approval / Blocked / Redacted). You can see governance applied across the whole orchestration at once.
- Risk & execution profile — blast radius, external integrations, privileged actions, escalations, participants, runs, and average runtime for the selected workflow.
See Agent Identity and Workflows for the underlying model.